
How Much Cash Does Buying a Business Require? Twenty Modeled Scenarios
On this page
Research date: September 17, 2026.
A low contribution percentage can make an acquisition look accessible while leaving the buyer unclear about the full resource requirement. The contribution is one number. Cash due at closing, earlier expenses, and funds retained after closing are others.
We built twenty scenarios to show how those amounts change when financing assumptions change. The model crosses four purchase prices with five configurations. It also calculates debt service, because a structure that needs less buyer cash can still leave the business with the same senior payment.
These are constructed examples, not completed Duneland transactions or a representative survey of buyers.
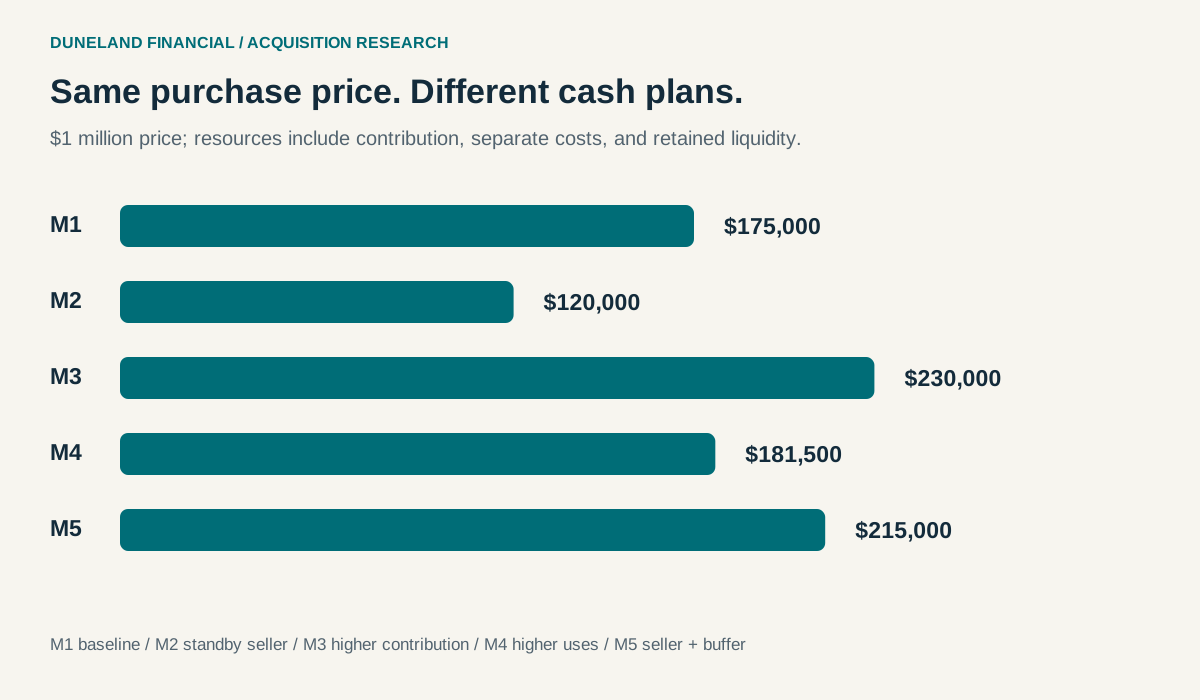
TL;DR: For the modeled $1 million purchase, total buyer resources range from $120,000 to $230,000 across five configurations. The lowest-resource case uses a qualifying standby seller note, but retains the same $990,000 senior loan as the baseline. A higher-project-cost case requires $181,500 of resources yet produces only 1.203× modeled coverage. The study demonstrates that contribution, total resources, and debt capacity must be evaluated separately. Model and methodology
What question does the model answer?
The model asks how specified changes in contribution, seller financing, additional project uses, and retained liquidity alter buyer resources and payment coverage. It does not estimate a market average or establish that a lender would approve any scenario. Scenario methodology
Purchase prices are $500,000, $1 million, $2 million, and $3 million. Each price is evaluated under the same five configurations. Costs and cash flow deliberately scale with price so readers can compare structures cleanly; real transaction costs and operating needs do not necessarily scale this way.
What assumptions are used?
Baseline project uses equal purchase price plus 7.5% incremental working capital and 2.5% assumed eligible project costs. Separate expenses are 1% of price already paid and 1.5% due at closing. Retained buyer liquidity is 4% of price except in M5, where it is 8%. None of these cost or liquidity percentages is presented as an SBA rule. Scenario methodology
| Configuration | Contribution and financing change |
|---|---|
| M1: Buyer-funded baseline | 10% of project uses from buyer; no seller debt |
| M2: Qualifying standby seller note | Same 10% required contribution, half supplied by qualifying seller debt |
| M3: Higher buyer contribution | 15% buyer contribution; no seller debt |
| M4: Higher project uses | Working capital 12.5% and project costs 4% of price; 10% buyer contribution |
| M5: Ordinary seller note and larger buffer | 10% buyer contribution; ordinary seller debt equal to 10% of project; retained liquidity 8% of price |
The M2 source treatment assumes the seller note satisfies the incoming SBA conditions. Under SOP 8.1, qualifying limited sources are collectively capped at half of required injection and standby seller debt has specific terms. The model does not independently approve eligibility. SOP 8.1, Appendix 15
What cash does each scenario require?
Cash due at closing equals buyer project contribution plus the separately assumed closing expenses. Total resources add previously paid separate expenses and retained liquidity. The model assumes no contribution credit for those separate expenses; an actual accepted credit would require a revised reconciliation. Scenario methodology
| Price | Configuration | Buyer project contribution | Cash due at closing | Total buyer resources |
|---|---|---|---|---|
| $500,000 | M1 | $55,000 | $62,500 | $87,500 |
| $500,000 | M2 | $27,500 | $35,000 | $60,000 |
| $500,000 | M3 | $82,500 | $90,000 | $115,000 |
| $500,000 | M4 | $58,250 | $65,750 | $90,750 |
| $500,000 | M5 | $55,000 | $62,500 | $107,500 |
| $1,000,000 | M1 | $110,000 | $125,000 | $175,000 |
| $1,000,000 | M2 | $55,000 | $70,000 | $120,000 |
| $1,000,000 | M3 | $165,000 | $180,000 | $230,000 |
| $1,000,000 | M4 | $116,500 | $131,500 | $181,500 |
| $1,000,000 | M5 | $110,000 | $125,000 | $215,000 |
| $2,000,000 | M1 | $220,000 | $250,000 | $350,000 |
| $2,000,000 | M2 | $110,000 | $140,000 | $240,000 |
| $2,000,000 | M3 | $330,000 | $360,000 | $460,000 |
| $2,000,000 | M4 | $233,000 | $263,000 | $363,000 |
| $2,000,000 | M5 | $220,000 | $250,000 | $430,000 |
| $3,000,000 | M1 | $330,000 | $375,000 | $525,000 |
| $3,000,000 | M2 | $165,000 | $210,000 | $360,000 |
| $3,000,000 | M3 | $495,000 | $540,000 | $690,000 |
| $3,000,000 | M4 | $349,500 | $394,500 | $544,500 |
| $3,000,000 | M5 | $330,000 | $375,000 | $645,000 |
The values are model outputs, not minimum-cash offers. Eligibility of costs, valuation support, lender acceptance, and transaction-specific requirements remain outside the model.
What changes when seller debt counts toward injection?
In the $1 million M2 case, project uses are $1.1 million. The assumed 10% injection is $110,000, split between $55,000 of buyer contribution and $55,000 of qualifying standby seller debt. Senior principal stays $990,000. Scenario results
Compared with M1, the buyer project contribution falls by 50%, but total buyer resources fall from $175,000 to $120,000, a 31.4% reduction. Other resource components have not fallen. This explains why “half the down payment” does not mean “half the total resources.”
The seller note also does not reduce current senior payments in this configuration. It replaces buyer funding, not senior principal. See SBA seller-note treatment.
Why can a larger cash budget still leave insufficient coverage?
M4 increases working capital and project costs, bringing the $1 million purchase’s project uses to $1.165 million. With 10% buyer contribution, senior debt rises to $1,048,500. Under the model’s payment and earnings assumptions, annual debt service is about $166,272 and coverage is 1.203×. Scenario results
For context, incoming 8.1 Initial Acquisitions require 1.25× under the specified historical or adjusted test. This mathematical example is below that threshold even though its full cash budget has been provided. The model’s assumed earnings are not a substitute for the lender’s accepted earnings calculation. SOP 8.1, Appendix 15
That is the central distinction: resource sufficiency does not prove repayment sufficiency.
How are debt payments and coverage calculated?
Senior debt is modeled at a fixed nominal annual 10%, with monthly payments over ten years. Ordinary seller debt in M5 uses 8% over ten years. M2’s qualifying standby note has no current payments in the model. Assumed annual cash flow equals 20% of purchase price. Rates and earnings are illustrative inputs, not observed market terms or valuations. Scenario methodology
| $1 million configuration | Annual modeled debt service | Modeled DSCR |
|---|---|---|
| M1 | $156,995 | 1.274× |
| M2 | $156,995 | 1.274× |
| M3 | $148,273 | 1.349× |
| M4 | $166,272 | 1.203× |
| M5 | $155,566 | 1.286× |
All purchase-price levels have the same ratios within a configuration because the modeled inputs scale proportionally. That is a design property, not evidence that acquisition size has no effect on real-world underwriting.
What happens under downside assumptions?
The model separately reduces earnings by 10% and raises the senior interest rate from 10% to 12%, holding other inputs fixed. In M1, coverage falls from 1.274× to 1.147× under lower earnings and to 1.173× under the higher rate. Scenario methodology and full outputs
Even M3, which uses 15% buyer contribution, falls from 1.349× to 1.214× when earnings decrease 10%. More equity improves the baseline but does not eliminate operating risk.
These are sensitivities, not predictions. The study does not assign probabilities or claim these shocks are sufficient stress tests for every industry.
What does the model deliberately leave out?
The model does not include a business valuation, actual eligibility review, tax consequences, investor ownership economics, changing rates over time, irregular disbursement periods, or a company-specific working-capital forecast. It also does not model the eventual repayment or accrual economics of M2’s standby note after the senior loan period. Scenario methodology
M5 changes both financing and retained liquidity, so its difference from M1 is not a single-variable effect. M3’s 15% contribution is an assumption, not a newly asserted SBA minimum. Costs related to specific diligence thresholds must be estimated from the actual scope rather than assumed adequately covered by our proportional cost line.
Frequently asked questions
Are these twenty acquisitions Duneland financed?
No. They are twenty constructed, reproducible scenarios.
Can I use the lowest number as my required cash?
Only as an illustration of those exact assumptions. Your actual project, source eligibility, expenses, and lender conditions can differ.
Why publish the full calculation files?
So readers and reviewers can reproduce the numbers, change assumptions, and see which result depends on which input. The package includes CSV, JSON, methodology, and a reusable calculation script.
Budget the whole transaction, then test the business
The scenarios show why a financing percentage should begin a calculation rather than end it. A buyer contribution can fall sharply while other cash needs remain. A larger resource budget can still accompany debt the modeled business does not support. A higher contribution can improve coverage without removing downside exposure.
Use that sequence in a real acquisition: define uses, establish accepted sources, separate closing cash from retained liquidity, and test the payments against documented earnings. Replace each assumption with transaction evidence as it becomes available.
Read the cash-required guide for the buyer-facing framework, or review your acquisition financing options with Duneland.
Continue reading
- How Much Cash Do You Really Need to Buy a Business With an SBA Loan?
- Can a Seller Note Reduce Your SBA Acquisition Cash Requirement?
- Acquisition financing library